Click here
to go back to the reports page.
First Copyright June 2002. Renewed July
2011. May be used provided proper citation is given.
See note at bottom.
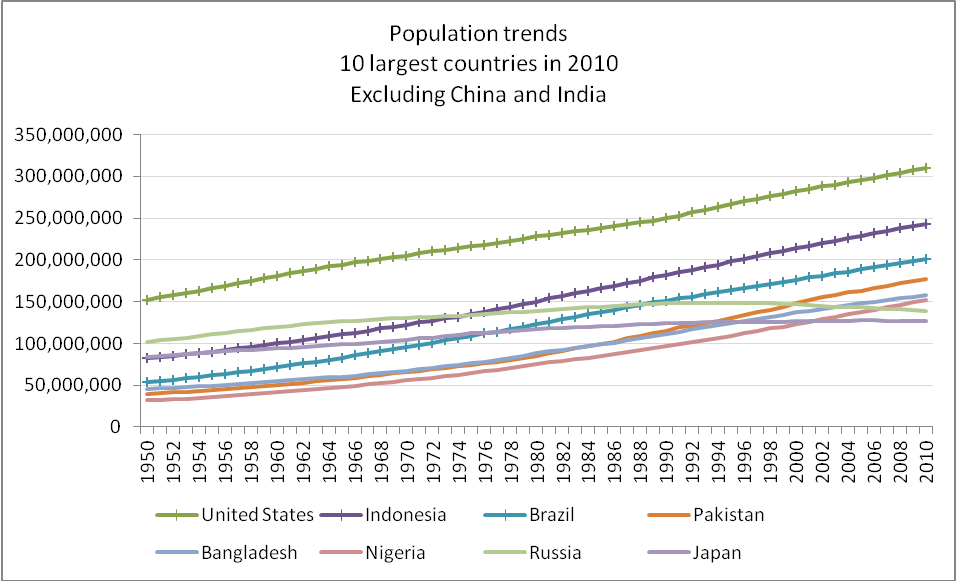
In this review, we describe world
population trends, where population has been
increasing, where it is increasing the most, where the least,
which countries are the largest, and what's happening to them.
In the next reports, we describe characteristics which may
help explain population trends. One report will focus on births
and deaths, the two components of net natural population change.
The second report will focus on migration, infant mortality rate
and fertility rate.
We also compare the results reported here to findings and
conclusions reported by other organizations, who use their own
data sets. For example, we compare results to findings
from the World Resources Institute, the Population Reference
Bureau, and other UN reports. As described below, the
conclusions reported here are similar to conclusions from other
organizations.
In this report, we first present a summary, then show graphs
and then tables.
All of the data in this
report are from the U.S. Census Bureau, International Data
Base
http://www.census.gov/population/international/data/idb/informationGateway.php
In this report, we use data from the US Census Bureau because
they have annual data. In the following reports, we use UN data.
The UN data is not annual, but has trend data for more variables
than does the US Census Bureau.
Chart 1
Chart 2
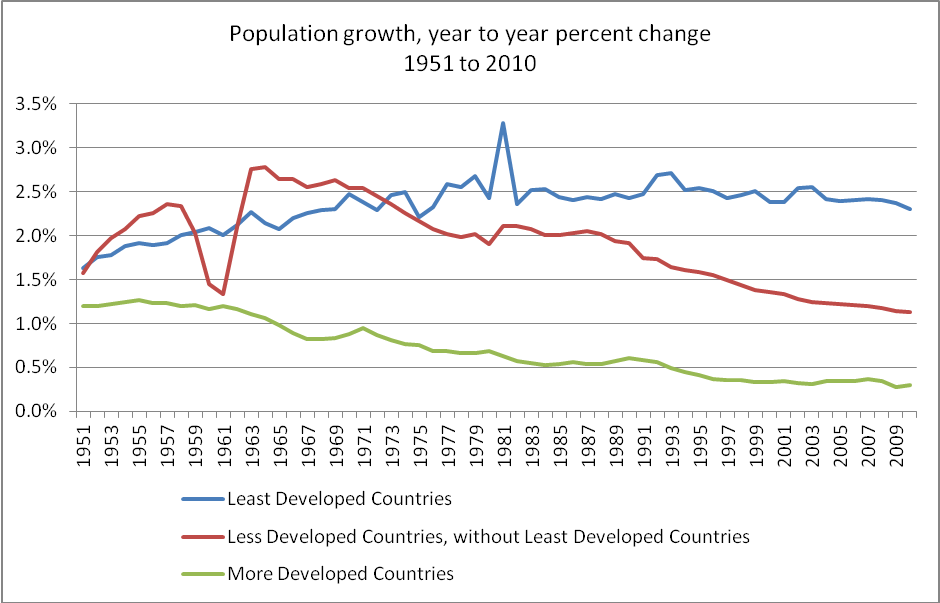
Chart 3
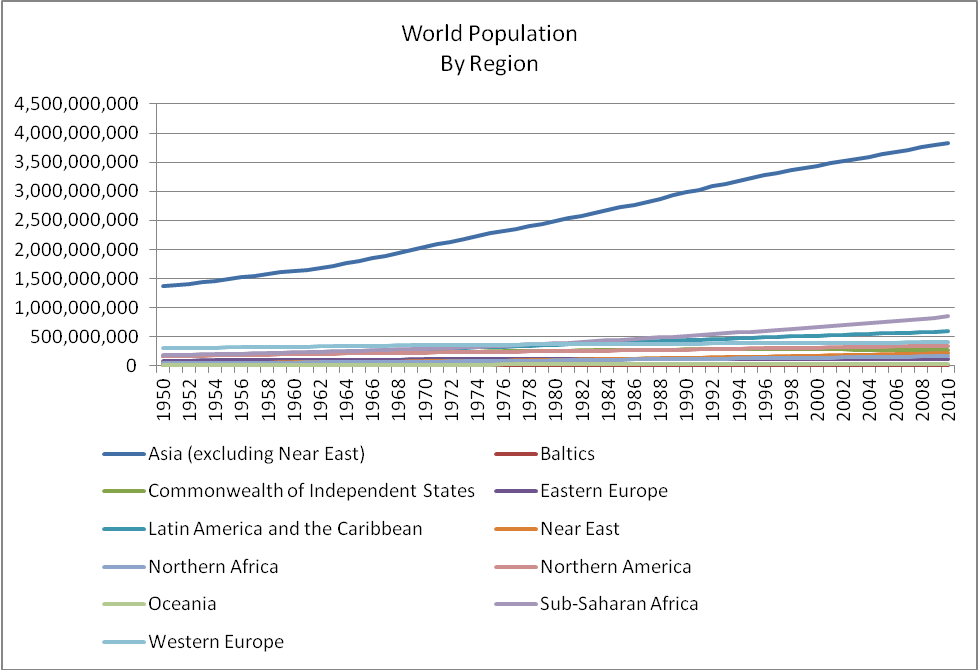
Chart 4
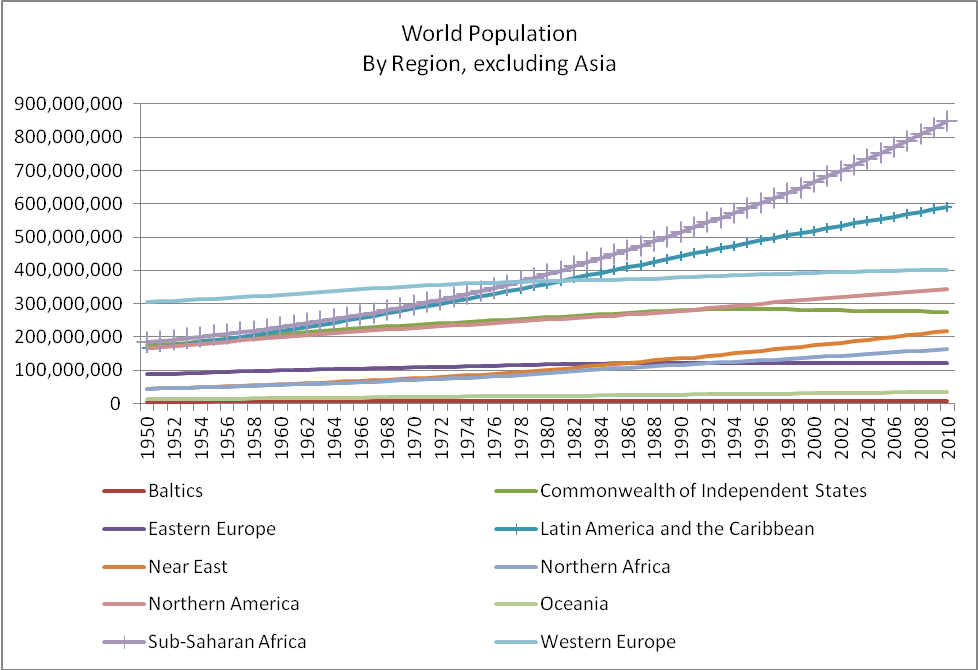
Chart 5
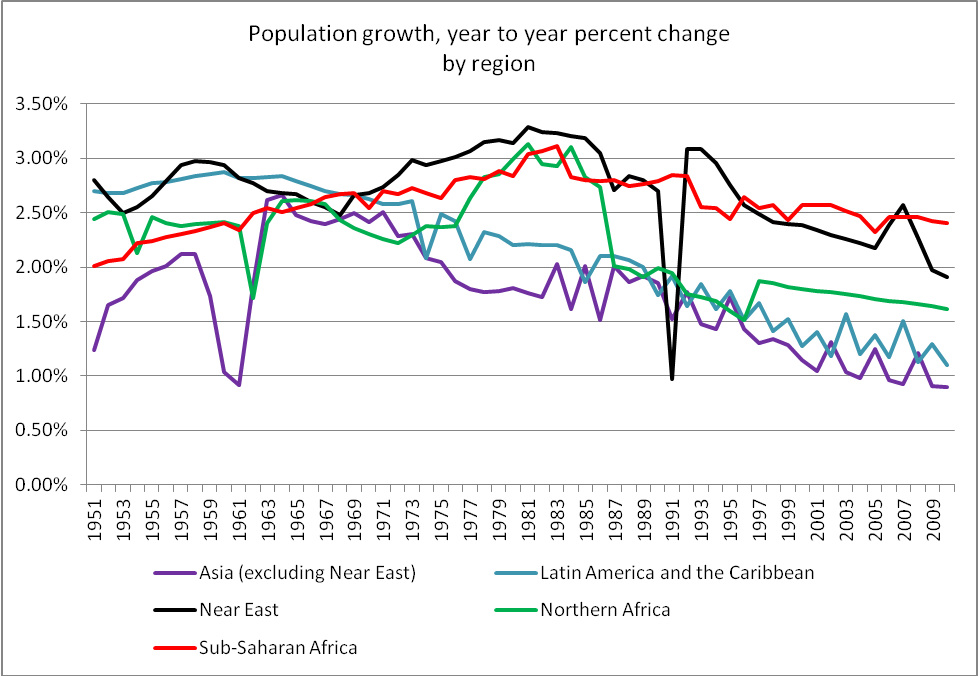
Chart 6
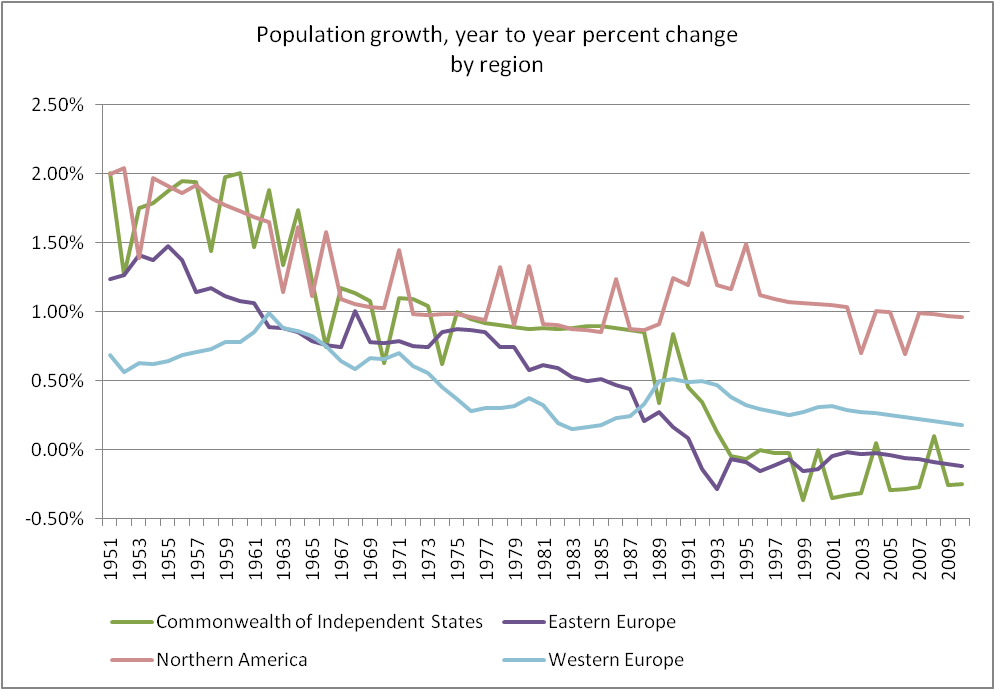
Chart 7

Chart 8
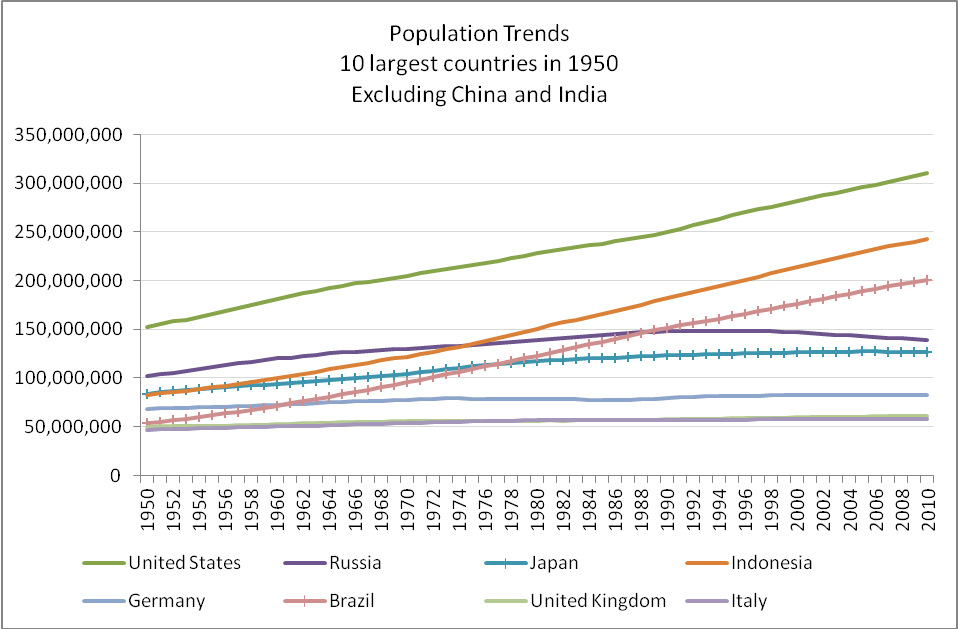
Chart 9
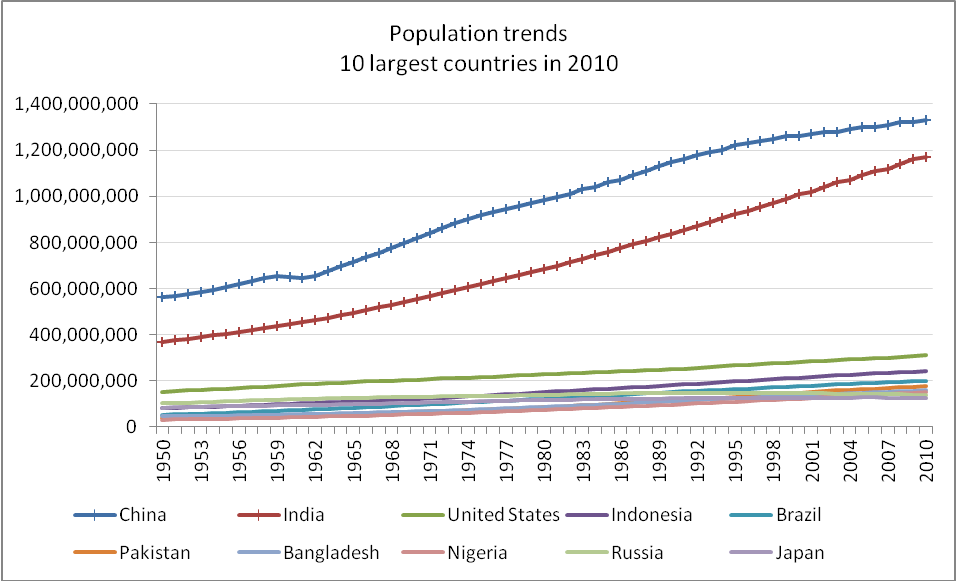
Chart 10
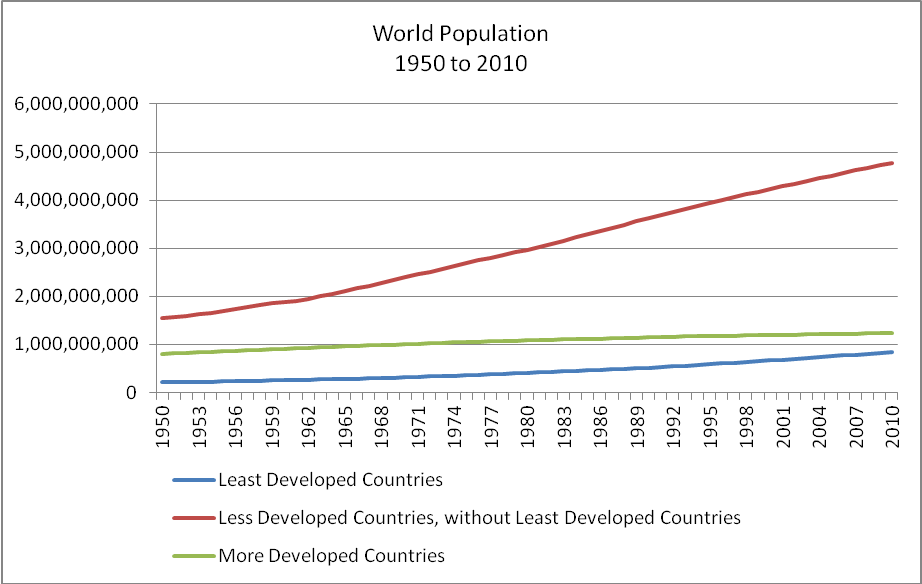
| 1950 | 1960 | 1970 | 1980 | 1990 | 2000 | 2010 | |
| Least Developed (LD) | 210,986,028 | 254,446,740 | 316,764,462 | 403,174,867 | 517,631,210 | 664,070,227 | 843,467,877 |
| Less Developed excluding LD | 1,538,482,170 | 1,877,270,443 | 2,392,631,143 | 2,968,084,634 | 3,627,309,455 | 4,232,053,072 | 4,775,879,507 |
| More Developed | 807,037,381 | 910,728,161 | 1,003,567,642 | 1,081,683,093 | 1,144,099,812 | 1,193,525,485 | 1,233,125,439 |
| All | 2,556,505,579 | 3,042,445,344 | 3,712,963,247 | 4,452,942,594 | 5,289,040,477 | 6,089,648,784 | 6,852,472,823 |
| Least Developed (LD), % of total | 8.3% | 8.4% | 8.5% | 9.1% | 9.8% | 10.9% | 12.3% |
| Less Developed excluding LD, % of total | 60.2% | 61.7% | 64.4% | 66.7% | 68.6% | 69.5% | 69.7% |
| More Developed, % of total | 31.6% | 29.9% | 27.0% | 24.3% | 21.6% | 19.6% | 18.0% |
| 1950 to 1960 | 1960 to 1970 | 1970 to 1980 | 1980 to 1990 | 1990 to 2000 | 2000 to 2010 | |
| Least Developed (LD) | 2.1% | 2.4% | 2.7% | 2.8% | 2.8% | 2.7% |
| Less Developed excluding LD | 2.2% | 2.7% | 2.4% | 2.2% | 1.7% | 1.3% |
| More Developed | 1.3% | 1.0% | 0.8% | 0.6% | 0.4% | 0.3% |
| All | 1.9% | 2.2% | 2.0% | 1.9% | 1.5% | 1.3% |
|
|
1950 |
1960 |
1970 |
1980 |
1990 |
2000 |
2010 |
|
Asia (excluding Near East) |
1,367,972,667 |
1,626,576,347 |
2,035,117,151 |
2,487,128,518 |
2,981,770,371 |
3,441,142,258 |
3,821,331,454 |
|
Baltics |
5,585,267 |
6,090,694 |
6,861,904 |
7,442,028 |
7,927,748 |
7,410,400 |
7,054,458 |
|
Commonwealth of Independent States |
174,048,754 |
208,057,609 |
235,370,733 |
258,440,942 |
280,461,499 |
281,598,745 |
275,480,103 |
|
Eastern Europe |
87,643,494 |
99,388,733 |
108,221,336 |
116,957,825 |
122,090,017 |
120,714,437 |
120,015,775 |
|
Latin America and the Caribbean |
165,448,976 |
217,500,078 |
285,248,597 |
360,347,786 |
442,190,583 |
519,256,619 |
590,420,199 |
|
Near East |
43,983,750 |
57,829,099 |
75,201,657 |
101,094,100 |
136,215,213 |
174,544,354 |
217,795,924 |
|
Northern Africa |
43,921,365 |
55,694,253 |
70,602,067 |
90,563,397 |
116,571,144 |
138,730,103 |
164,227,479 |
|
Northern America |
166,077,185 |
199,348,547 |
226,854,492 |
252,704,224 |
277,910,347 |
313,225,944 |
343,891,657 |
|
Oceania |
12,476,128 |
15,609,191 |
19,230,220 |
22,535,771 |
26,421,592 |
30,487,980 |
35,097,801 |
|
Sub-Saharan Africa |
184,036,893 |
229,447,210 |
295,317,379 |
387,613,786 |
514,558,604 |
665,015,340 |
848,511,244 |
|
Western Europe |
305,112,531 |
326,653,963 |
352,709,839 |
368,035,494 |
378,569,936 |
392,306,989 |
401,983,774 |
|
Total |
2,556,307,010 |
3,042,195,724 |
3,710,735,375 |
4,452,863,871 |
5,284,687,054 |
6,084,433,169 |
6,825,809,868 |
| 1951 | 1960 | 1970 | 1980 | 1990 | 2000 | 2010 | |
| Asia (excluding Near East) | 1.2% | 1.0% | 2.4% | 1.8% | 1.9% | 1.1% | 0.9% |
| Baltics | 0.7% | 1.4% | 1.1% | 0.6% | 0.1% | -0.4% | -0.4% |
| Commonwealth of Independent States | 2.0% | 2.0% | 0.6% | 0.9% | 0.8% | 0.0% | -0.2% |
| Eastern Europe | 1.2% | 1.1% | 0.8% | 0.6% | 0.2% | -0.1% | -0.1% |
| Latin America and the Caribbean | 2.7% | 2.9% | 2.6% | 2.2% | 1.7% | 1.3% | 1.1% |
| Near East | 2.8% | 2.9% | 2.7% | 3.1% | 2.7% | 2.4% | 1.9% |
| Northern Africa | 2.4% | 2.4% | 2.3% | 3.0% | 2.0% | 1.8% | 1.6% |
| Northern America | 2.0% | 1.7% | 1.0% | 1.3% | 1.2% | 1.1% | 1.0% |
| Oceania | 2.6% | 2.2% | 2.3% | 1.4% | 1.8% | 1.4% | 1.3% |
| Sub-Saharan Africa | 2.0% | 2.4% | 2.5% | 2.8% | 2.8% | 2.6% | 2.4% |
| Western Europe | 0.7% | 0.8% | 0.7% | 0.4% | 0.5% | 0.3% | 0.2% |
| |
1950 |
1960 |
1970 |
1980 |
1990 |
2000 |
2010 |
|
Asia (excluding Near East) |
53.5% |
53.5% |
54.8% |
55.9% |
56.4% |
56.6% |
56.0% |
|
Baltics |
0.2% |
0.2% |
0.2% |
0.2% |
0.2% |
0.1% |
0.1% |
|
Commonwealth of Independent States |
6.8% |
6.8% |
6.3% |
5.8% |
5.3% |
4.6% |
4.0% |
|
Eastern Europe |
3.4% |
3.3% |
2.9% |
2.6% |
2.3% |
2.0% |
1.8% |
|
Latin America and the Caribbean |
6.5% |
7.1% |
7.7% |
8.1% |
8.4% |
8.5% |
8.6% |
|
Near East |
1.7% |
1.9% |
2.0% |
2.3% |
2.6% |
2.9% |
3.2% |
|
Northern Africa |
1.7% |
1.8% |
1.9% |
2.0% |
2.2% |
2.3% |
2.4% |
|
Northern America |
6.5% |
6.6% |
6.1% |
5.7% |
5.3% |
5.1% |
5.0% |
|
Oceania |
0.5% |
0.5% |
0.5% |
0.5% |
0.5% |
0.5% |
0.5% |
|
Sub-Saharan Africa |
7.2% |
7.5% |
8.0% |
8.7% |
9.7% |
10.9% |
12.4% |
|
Western Europe |
11.9% |
10.7% |
9.5% |
8.3% |
7.2% |
6.4% |
5.9% |
|
Total |
100.0% |
100.0% |
100.0% |
100.0% |
100.0% |
100.0% |
100.0% |
| 1950 | 1960 | 1970 | 1980 | 1990 | 2000 | 2010 | |
| China | 563,000,000 | 651,000,000 | 820,000,000 | 985,000,000 | 1,150,000,000 | 1,260,000,000 | 1,330,000,000 |
| India | 370,000,000 | 445,000,000 | 554,000,000 | 685,000,000 | 838,000,000 | 1,010,000,000 | 1,170,000,000 |
| United States | 152,000,000 | 181,000,000 | 205,000,000 | 228,000,000 | 250,000,000 | 282,000,000 | 310,000,000 |
| Russia | 102,000,000 | 120,000,000 | 130,000,000 | 139,000,000 | 148,000,000 | 147,000,000 | 139,000,000 |
| Japan | 83,805,000 | 94,091,638 | 104,000,000 | 117,000,000 | 124,000,000 | 127,000,000 | 127,000,000 |
| Indonesia | 82,978,392 | 100,000,000 | 122,000,000 | 150,000,000 | 182,000,000 | 214,000,000 | 243,000,000 |
| Germany | 68,374,572 | 72,480,869 | 77,783,164 | 78,297,904 | 79,380,394 | 82,187,909 | 82,282,988 |
| Brazil | 53,443,075 | 71,694,810 | 95,684,297 | 123,000,000 | 151,000,000 | 176,000,000 | 201,000,000 |
| United Kingdom | 50,127,000 | 52,372,000 | 55,632,000 | 56,314,000 | 57,493,307 | 59,522,468 | 61,284,806 |
| Italy | 47,105,000 | 50,197,600 | 53,661,100 | 56,451,247 | 56,742,886 | 57,719,337 | 58,090,681 |
| World | 2,556,307,010 | 3,042,195,724 | 3,710,735,375 | 4,452,863,871 | 5,284,687,054 | 6,084,433,169 | 6,825,809,868 |
| Ten as % of world | 62% | 60% | 60% | 59% | 57% | 56% | 55% |
| China, India as % of world | 36% | 36% | 37% | 38% | 38% | 37% | 37% |
| US as % of world | 6% | 6% | 6% | 5% | 5% | 5% | 5% |
| 1950 | 1960 | 1970 | 1980 | 1990 | 2000 | 2010 | |
| China | 563,000,000 | 651,000,000 | 820,000,000 | 985,000,000 | 1,150,000,000 | 1,260,000,000 | 1,330,000,000 |
| India | 370,000,000 | 445,000,000 | 554,000,000 | 685,000,000 | 838,000,000 | 1,010,000,000 | 1,170,000,000 |
| United States | 152,000,000 | 181,000,000 | 205,000,000 | 228,000,000 | 250,000,000 | 282,000,000 | 310,000,000 |
| Indonesia | 82,978,392 | 100,000,000 | 122,000,000 | 150,000,000 | 182,000,000 | 214,000,000 | 243,000,000 |
| Brazil | 53,443,075 | 71,694,810 | 95,684,297 | 123,000,000 | 151,000,000 | 176,000,000 | 201,000,000 |
| Pakistan | 39,448,232 | 50,386,898 | 65,705,964 | 85,219,117 | 115,000,000 | 148,000,000 | 177,000,000 |
| Bangladesh | 45,645,964 | 54,592,652 | 67,331,349 | 87,937,333 | 111,000,000 | 137,000,000 | 158,000,000 |
| Nigeria | 31,796,939 | 41,547,479 | 55,585,637 | 74,821,273 | 96,603,759 | 123,000,000 | 152,000,000 |
| Russia | 102,000,000 | 120,000,000 | 130,000,000 | 139,000,000 | 148,000,000 | 147,000,000 | 139,000,000 |
| Japan | 83,805,000 | 94,091,638 | 104,000,000 | 117,000,000 | 124,000,000 | 127,000,000 | 127,000,000 |
| World | 2,556,307,010 | 3,042,195,724 | 3,710,735,375 | 4,452,863,871 | 5,284,687,054 | 6,084,433,169 | 6,825,809,868 |
| Ten as % of world |
60% | 59% | 60% | 60% | 60% | 60% | 59% |
Comparisons with reports from other sources
A number of other reports also describe data or trends
about demographics. Some of these reports include:
The US Census Bureau shows world population and growth
rates http://www.census.gov/population/international/data/idb/worldpopinfo.php
Data
Population: U.S. Bureau of Census
The US Census Bureau developed an International Data Base,
available at http://www.census.gov/population/international/data/idb/informationGateway.php
which "is a computerized data bank
containing statistical tables of demographic, and
socio-economic data for 227 countries and areas of the world."
The data base contains data on variables such as population,
percent urban, births, deaths, fertility rates, and
others. The data set is fairly complete for most
demographic and socio-economic variables for the year
2000. Completeness for variables for other years vary
quite a bit. For example, population estimates and
projections are available for all countries for time periods
from 1950 to 2050. On the other hand, infant mortality
is only available for 110 countries for 1980.
The IDB lists independent countries and
dependencies http://www.census.gov/population/international/data/idb/countries.php
As of September 2011, there are 193 independent countries and
57 dependencies, and Taiwan, which is ... in dispute.
The Census Bureau also categorizes countries and states into more and less developed. At the International Data Base, click on regions, and then you can select more or less developing countries to get a list.
The Census Bureau's data set is public domain. All
of the tables and charts were prepared by Gene Shackman.
Prepared by Gene Shackman, Wang Xun and Ya-Lin Liu
First Copyright June 2002. Updated in September 2011
May be used provided proper citation is given.
Cite as
Shackman, Gene, Xun Wang and Ya-Lin Liu. 2011. Brief
review
of world population trends. Available at
http://gsociology.icaap.org/report/demsum.html
All of the tables and charts are based on public domain
data. All tables are public domain. All charts may be used
freely provided that the proper citation is given (Shackman et
al) cited