Brief review of trends in world energy production and use
Click here to go back to
reports
page.
This chapter may be freely cited, provided proper citation is
given. See
bottom for notice
This report was prepared using Mozilla and doesn't show properly in
internet explorer. For a version that shows up better in IE, click here
http://gsociology.icaap.org/report/test/energytrends.html
In this review, we describe technology trends, focusing on
world energy production and
consumption
and changes in those
characteristics.
The amount and type of energy produced and consumed are
indicators of technological development, as is the use of the internet,
TV, radio, described in another of our reports.. Technology is an
important part of the infrastructure of today's society and thus should
help in understanding society's growth and development.
Specific characteristics in this report include:
Energy
production trends, and types of energy produced, world, OECD and non
OECD 1980
to 2002.
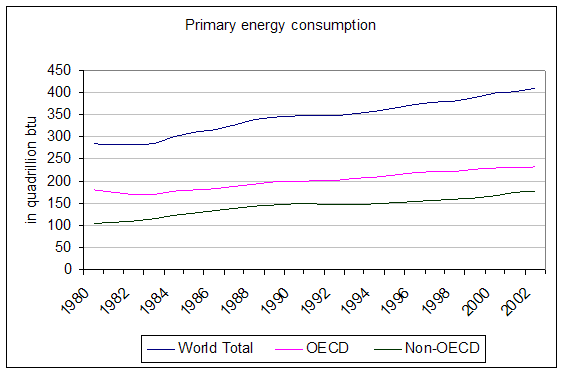
Energy
consumption trends, and types of energy consumed, world, OECD and non
OECD 1980
to 2002.
These reports are based on data from the U.S. Energy Information
Administration's (EIA) International Energy Annual,
http://www.eia.doe.gov/iea/
Additional information is from the EIA overview report at http://www.eia.doe.gov/emeu/iea/overview.html.
I Summary
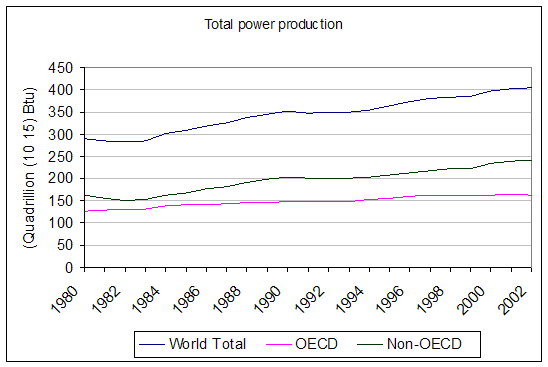
- Overall, there has been an increase in production and consumption of energy.
- In 2002, for the world as a whole, petroleum was the primary energy source, followed by coal, then dry natural gas (EIA overview).
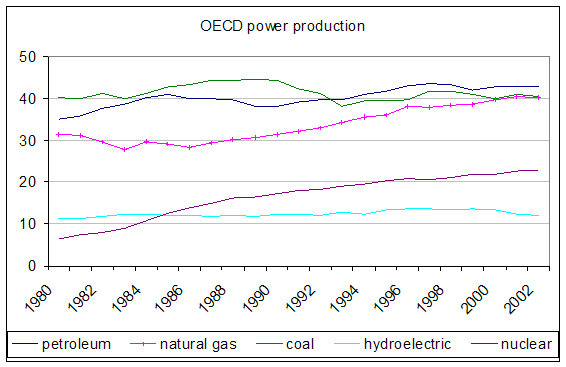
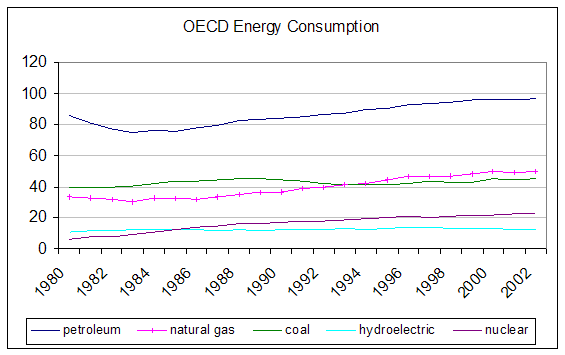
- Over this 22 year period, in the OECD countries, natural gas and nuclear energy became increasingly important as sources of energy.
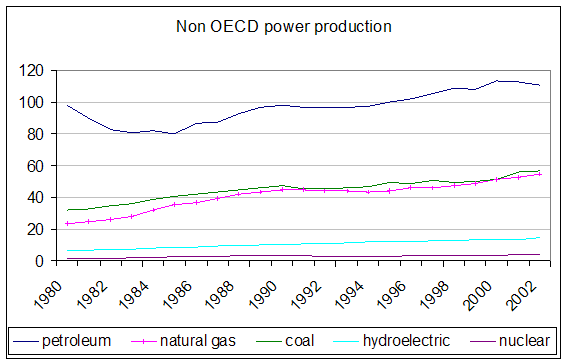
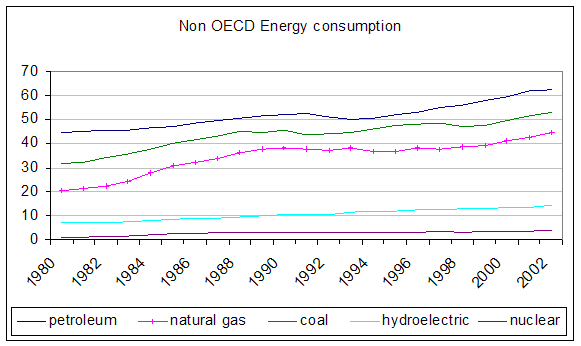
- In non OECD countries, as a group, use of petroleum increased, as did use of coal and natural gas. Use of hydroelectric and nuclear energy as sources of energy also increased although these sources remained a small percentage of total energy.
- “The
- In 2002, three of those countries,
-
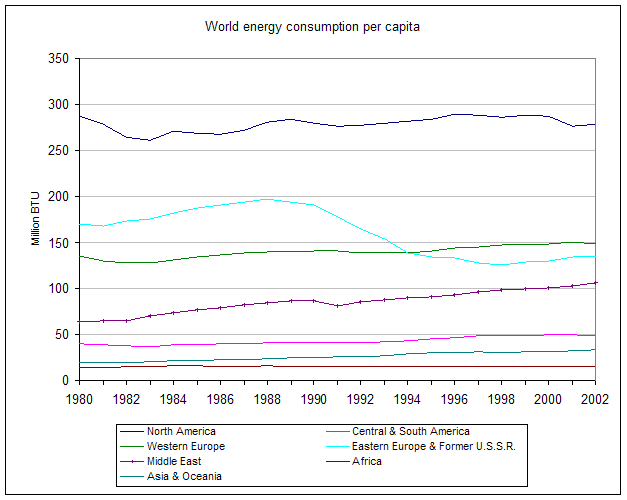
Most of the countries with the lowest energy consumption per capita, both in 1980 and 2002, were in Africa and Asia and Oceana. The countries with the highest energy consumption per capita were in mainly in Asia and Oceania, the Middle East, North America and Western Europe.
- Two countries with high energy
consumption per capita (Unites States and Canada) have large
combined populations so most of the people
who live in countries with high energy consumption per capita live in
North America.
II Detailed Data
Energy Production
Energy
Consumption
Energy
consumption per
capita
|
Countries
with lowest energy consumption per capita in 1980
Africa Saint Helena, Burundi, Rwanda, Ethiopia, Burkina Faso, Chad Asia and Oceania Bhutan, Cambodia, Nepal |
|
Countries
with highest energy consumption per capita in 1980
Asia/Oceania Guam and Brunei Central and South America US Virgin Islands and Netherlands Antilles (Central/South America), Middle East Quatar, Bahrain, Kuwait North America Canada, Saint Pierre and Miquelon, United States of America Western Europe Luxembourg |
|
Countries
with lowest energy consumption per capita in 2002
Africa Chad, Ethiopia, Mali, Burundi, Somalia, Burkana Faso Asia and Oceania Cambodia, Afghanistan |
|
Countries
with highest energy consumption per capita in 2002
Asia and Oceania Singapore Central and South America Netherlands Antilles, US Virgin Islands, Trinidad and Tobago Middle East Bahrain, Kuwait, Quatar and United Arab Emirates North America Canada, United States of America Western Europe Gibraltar, Iceland and Norway, Luxembourg |
III Appendix
A. Comparison with other data sources:
Key World Energy Statistics -- 2004 Edition (KWES), http://www.iea.org/bookshop/add.aspx?id=144
from the International Energy Agency, http://www.iea.org/.
This report shows a number of points similar to the US EIA reports. For
example, the KWES similarly shows world energy production increasing,
that petroleum or oil is the major source for energy consumption, and
that the share
of gas
and nuclear energy as sources of energy production are increasing in
the
OECD.
B. Data
All data are based on the following tables:
Table 2.9 World Production of Primary Energy by Energy Type and
Selected
Country Groups (Quadrillion Btu) , 1980-2002
http://www.eia.doe.gov/emeu/iea/wepbtu.html
Table 1.8 World Consumption of Primary Energy by Energy Type and
Selected
Country Groups (Quadrillion Btu), 1980-2002
http://www.eia.doe.gov/emeu/iea/wecbtu.html
http://www.eia.doe.gov/emeu/iea/wecbtu.html
Prepared by Gene Shackman,
Wang Xun and Ya-Lin Liu
First Copyright September 2004. May be
used provided proper citation is given.
Cite as
Shackman, Gene, Xun
Wang and Ya-Lin Liu. 2004. Brief review of trends in world energy
production and
use. Available at
http://gsociology.icaap.org/report/energy/energytrends.htm
This report was prepared using Mozilla http://www.mozilla.org/
Click here
to go back
to reports page.
last updated