s
Source: World Population Prospects: The 2010 Revision, United Nations Population Division, UN Data, http://data.un.org
|
GLOBAL SOCIAL
CHANGE RESEARCH PROJECT
WORLD TREND REPORTS |
Click here
to go back to the reports page.
First Copyright February 2012, renewed November 2012.
May be used provided proper citation is given. See
note at bottom.
This is the fourth in a set of reports about global
demographic trends. In this set of reports, we describe global
population trends and demographic characteristics which may help
to explain those global population trends, that is, changes in
the number of people and where they live. This set of
reports is part of a larger project describing basic world
social, political and economic trends, in ways that can be
easily understood by anyone, and that can help to understand the
world today.
This report focuses on age and age distributions.
Summary
The major points of trends in age and age distribution are shown
in the summary table below
| Summary Table: Age Distributions, by Region | ||||
| % 0-14 | % 60+ | |||
| 1950 | 2010 | 1950 | 2010 | |
| Asia | 37% | 26% | 7% | 10% |
| Latin America and the Caribbean | 40% | 28% | 6% | 10% |
| North Africa | 41% | 32% | 6% | 7% |
| Sub-Saharan Africa | 42% | 42% | 5% | 5% |
| Europe | 26% | 15% | 12% | 22% |
| North America | 27% | 20% | 12% | 19% |
| World |
34% |
27% |
8% |
11% |
Briefly, the basic findings of this report are: 1) in all regions, the
largest group is the adults (15-59 years old), 2) in Asia, Africa,
and Latin America and the Caribbean, there are more
children than there are seniors, while, recently, in
Europe there are more seniors than children, and in Northern
America there will soon be, 3) in almost all regions,
the proportion of the population who are children is declining
while the proportion who are seniors is increasing.
Sub-Saharan Africa is an exception. There are almost as many
children as there are seniors, and the proportions of
the population who are seniors and children have not yet changed.
Changes in age distributions have many implications for
society. For example, a larger proportion of younger people
means more people who have yet to attain adulthood and who can
be expected to have more children which means continued
population growth. So, Sub-Saharan Africa, which has the
highest proportion of children, also has the highest population
growth rates (as seen in previous reports), and can be expected
to continue to have the highest population growth rates.
Similarly, Europe and North America, which have the lowest
proportion of children, also have the lowest population growth
rates, which can be expected to continue to be low. Also, since
most regions have declining proportions of children, most
regions have declining population growth rates and will likely
continue to have declining population growth rates.
Detailed
Descriptions of Trends in Age and Age Distributions.
All regions
Chart 1
s
Source: World Population Prospects: The 2010 Revision, United
Nations Population Division, UN Data, http://data.un.org
Chart 2

Source: World Population Prospects: The 2010 Revision, United
Nations Population Division, UN Data, http://data.un.org
Chart 3

Source: World Population Prospects: The 2010 Revision, United
Nations Population Division, UN Data, http://data.un.org
Chart 4

Source: World Population Prospects: The 2010 Revision, United
Nations Population Division, UN Data, http://data.un.org
Chart 5

Source: World Population Prospects: The 2010 Revision, United
Nations Population Division, UN Data, http://data.un.org
Chart 6

Source: World Population Prospects: The 2010 Revision, United
Nations Population Division, UN Data, http://data.un.org
Chart 7

Source: World Population Prospects: The 2010 Revision, United
Nations Population Division, UN Data, http://data.un.org
Chart 8

Source: World Population Prospects: The 2010 Revision, United
Nations Population Division, UN Data, http://data.un.org
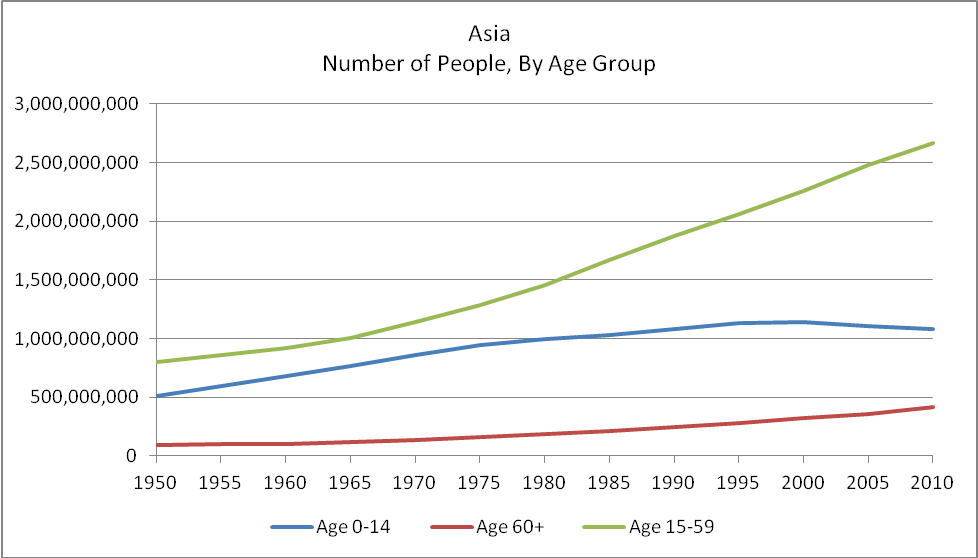
| Asia, Number of People, by age group | |||||
| Age 0-14 | Age 60+ | Age 15-59 | % 0-14 | % 60+ | |
| 1950 | 512,343,111 | 93,642,967 | 797,402,509 | 37% | 7% |
| 1955 | 594,528,428 | 97,404,840 | 857,359,457 | 38% | 6% |
| 1960 | 681,026,578 | 104,714,303 | 921,941,497 | 40% | 6% |
| 1965 | 768,423,369 | 113,950,014 | 1,003,812,350 | 41% | 6% |
| 1970 | 860,621,069 | 133,356,404 | 1,141,015,175 | 40% | 6% |
| 1975 | 948,358,965 | 157,175,633 | 1,287,521,055 | 40% | 7% |
| 1980 | 995,559,041 | 182,624,325 | 1,459,402,152 | 38% | 7% |
| 1985 | 1,028,314,685 | 209,977,321 | 1,668,558,832 | 35% | 7% |
| 1990 | 1,079,241,422 | 243,222,301 | 1,877,017,150 | 34% | 8% |
| 1995 | 1,130,390,136 | 281,499,921 | 2,058,556,045 | 33% | 8% |
| 2000 | 1,138,849,803 | 320,725,437 | 2,259,468,998 | 31% | 9% |
| 2005 | 1,103,204,443 | 359,411,377 | 2,482,376,540 | 28% | 9% |
| 2010 | 1,079,755,067 | 414,174,458 | 2,670,322,772 | 26% | 10% |
| Latin America and the Caribbean, Number of People, by age group | |||||
| Age 0-14 | Age 60+ | Age 15-59 | % 0-14 | % 60+ | |
| 1950 | 67,285,334 | 9,391,567 | 90,691,323 | 40% | 6% |
| 1955 | 78,963,244 | 10,816,167 | 101,927,766 | 41% | 6% |
| 1960 | 93,133,722 | 12,888,361 | 114,036,099 | 42% | 6% |
| 1965 | 108,718,066 | 15,293,870 | 128,593,023 | 43% | 6% |
| 1970 | 121,594,225 | 18,037,264 | 146,745,655 | 42% | 6% |
| 1975 | 132,950,091 | 21,056,693 | 169,066,863 | 41% | 7% |
| 1980 | 142,656,839 | 24,151,760 | 195,517,419 | 39% | 7% |
| 1985 | 152,469,581 | 27,871,854 | 222,051,983 | 38% | 7% |
| 1990 | 160,129,960 | 32,552,001 | 250,349,699 | 36% | 7% |
| 1995 | 164,416,100 | 37,596,808 | 280,634,147 | 34% | 8% |
| 2000 | 165,955,927 | 43,558,464 | 311,914,726 | 32% | 8% |
| 2005 | 166,330,429 | 50,240,413 | 340,466,866 | 30% | 9% |
| 2010 | 164,473,115 | 58,728,469 | 366,880,439 | 28% | 10% |
| Northern Africa, Number of People, by age group | |||||
| Age 0-14 | Age 60+ | Age 15-59 | % 0-14 | % 60+ | |
| 1950 | 21,784,666 | 2,979,037 | 28,218,692 | 41% | 6% |
| 1955 | 25,237,553 | 3,236,201 | 31,087,121 | 42% | 5% |
| 1960 | 29,726,670 | 3,545,921 | 34,220,793 | 44% | 5% |
| 1965 | 34,179,867 | 3,985,830 | 38,176,434 | 45% | 5% |
| 1970 | 39,372,387 | 4,853,970 | 42,716,337 | 45% | 6% |
| 1975 | 44,235,421 | 5,302,560 | 49,257,967 | 45% | 5% |
| 1980 | 49,193,566 | 6,296,326 | 57,581,985 | 44% | 6% |
| 1985 | 55,707,538 | 7,158,008 | 67,089,915 | 43% | 6% |
| 1990 | 60,794,010 | 8,410,659 | 76,983,426 | 42% | 6% |
| 1995 | 63,357,636 | 9,866,427 | 88,170,666 | 39% | 6% |
| 2000 | 63,589,716 | 11,445,916 | 101,130,225 | 36% | 6% |
| 2005 | 63,870,083 | 12,968,789 | 115,177,877 | 33% | 7% |
| 2010 | 66,125,024 | 15,471,004 | 127,863,156 | 32% | 7% |
| Sub-Saharan Africa, Number of People, by age group | |||||
| Age 0-14 | Age 60+ | Age 15-59 | % 0-14 | % 60+ | |
| 1950 | 77,949,614 | 9,738,425 | 98,414,571 | 42% | 5% |
| 1955 | 87,422,562 | 10,464,103 | 108,348,464 | 42% | 5% |
| 1960 | 99,127,791 | 11,506,588 | 120,162,598 | 43% | 5% |
| 1965 | 113,690,069 | 12,880,454 | 134,024,325 | 44% | 5% |
| 1970 | 130,855,964 | 14,458,334 | 150,656,548 | 44% | 5% |
| 1975 | 151,563,954 | 16,375,008 | 170,715,214 | 45% | 5% |
| 1980 | 175,978,990 | 18,718,921 | 195,104,327 | 45% | 5% |
| 1985 | 203,651,133 | 21,396,148 | 223,815,961 | 45% | 5% |
| 1990 | 233,196,262 | 24,543,665 | 257,853,116 | 45% | 5% |
| 1995 | 262,586,082 | 28,228,441 | 298,862,601 | 45% | 5% |
| 2000 | 293,407,366 | 32,283,814 | 343,431,648 | 44% | 5% |
| 2005 | 326,992,448 | 37,225,966 | 393,295,032 | 43% | 5% |
| 2010 | 363,062,760 | 43,057,595 | 450,206,802 | 42% | 5% |
| Europe, Number of People, by age group | |||||
| Age 0-14 | Age 60+ | Age 15-59 | % 0-14 | % 60+ | |
| 1950 | 143,205,497 | 66,338,309 | 337,743,314 | 26% | 12% |
| 1955 | 147,057,919 | 71,709,222 | 356,469,004 | 26% | 12% |
| 1960 | 161,439,797 | 79,290,626 | 363,123,156 | 27% | 13% |
| 1965 | 168,238,747 | 90,166,086 | 375,185,933 | 27% | 14% |
| 1970 | 166,178,849 | 101,619,530 | 388,080,236 | 25% | 15% |
| 1975 | 160,425,649 | 111,390,073 | 404,307,442 | 24% | 16% |
| 1980 | 153,616,338 | 111,404,510 | 427,848,163 | 22% | 16% |
| 1985 | 150,334,172 | 119,494,911 | 436,970,658 | 21% | 17% |
| 1990 | 147,627,521 | 131,120,907 | 441,748,705 | 20% | 18% |
| 1995 | 140,266,831 | 138,296,238 | 448,859,046 | 19% | 19% |
| 2000 | 127,660,301 | 147,879,883 | 451,237,057 | 18% | 20% |
| 2005 | 115,911,303 | 150,486,007 | 464,338,430 | 16% | 21% |
| 2010 | 113,993,149 | 161,222,924 | 462,982,528 | 15% | 22% |
| Northern America, Number of People, by age group | |||||
| Age 0-14 | Age 60+ | Age 15-59 | % 0-14 | % 60+ | |
| 1950 | 46,696,545 | 21,288,453 | 103,629,870 | 27% | 12% |
| 1955 | 55,573,658 | 24,189,105 | 107,197,262 | 30% | 13% |
| 1960 | 63,488,978 | 26,617,514 | 114,211,013 | 31% | 13% |
| 1965 | 67,014,860 | 29,009,088 | 123,199,714 | 31% | 13% |
| 1970 | 65,950,563 | 31,977,177 | 133,356,633 | 29% | 14% |
| 1975 | 61,249,317 | 35,310,432 | 145,800,628 | 25% | 15% |
| 1980 | 57,528,784 | 39,441,809 | 157,482,959 | 23% | 16% |
| 1985 | 58,065,097 | 43,525,372 | 165,488,963 | 22% | 16% |
| 1990 | 60,749,517 | 46,755,300 | 173,656,760 | 22% | 17% |
| 1995 | 64,318,898 | 48,459,260 | 182,970,974 | 22% | 16% |
| 2000 | 66,264,268 | 50,984,525 | 196,040,182 | 21% | 16% |
| 2005 | 66,606,178 | 55,416,010 | 207,208,978 | 20% | 17% |
| 2010 | 67,926,924 | 63,967,972 | 212,633,928 | 20% | 19% |
| Age Distributions, by Region | ||||
| % 0-14 | % 60+ | |||
| 1950 | 2010 | 1950 | 2010 | |
| Asia | 37% | 26% | 7% | 10% |
| Latin America and the Caribbean | 40% | 28% | 6% | 10% |
| North Africa | 41% | 32% | 6% | 7% |
| Sub-Saharan Africa | 42% | 42% | 5% | 5% |
| Europe | 26% | 15% | 12% | 22% |
| North America | 27% | 20% | 12% | 19% |
| World |
34% |
27% |
8% |
11% |
World Population Prospects: The 2010 Revision, United
Nations Population Division, UN Data, http://data.un.org
All of the tables and charts in this reports were prepared
by Gene Shackman.
All of the data used in this report are from the United
Nations http://data.un.org/
They write, "All data and metadata provided on UNdata’s website
are available free of charge and may be copied freely,
duplicated and further distributed provided that UNdata is cited
as the reference." http://data.un.org/Host.aspx?Content=UNdataUse
Thus, all charts and tables in our report may be used
freely, provided the proper citation is given (Shackman et al,
2012, from data provided by UNData). All text from this
report may be used freely provided that the proper citation is
given (Shackman et al. 2012).
Prepared by Gene Shackman, Wang Xun and Ya-Lin Liu